
The market is narrowing: only 25% of S&P 500 stocks are above the 50-day average
The S&P 500 does not yet look like a market experiencing a large-scale collapse. But if you look not at the index itself, but at its internal structure, the picture becomes noticeably weaker.
According to the data presented in the original schedule, only25% of S&P 500 stocks are now trading above their 50-day moving average. This is one of the lowest rates since the beginning of April and a sharp deterioration compared to about70% in mid-August.
In other words, the index may look relatively stable, while fewer individual companies support this movement.
That's what it's calledmarket breadth— an indicator of how widely the movement of the index is distributed among its components.
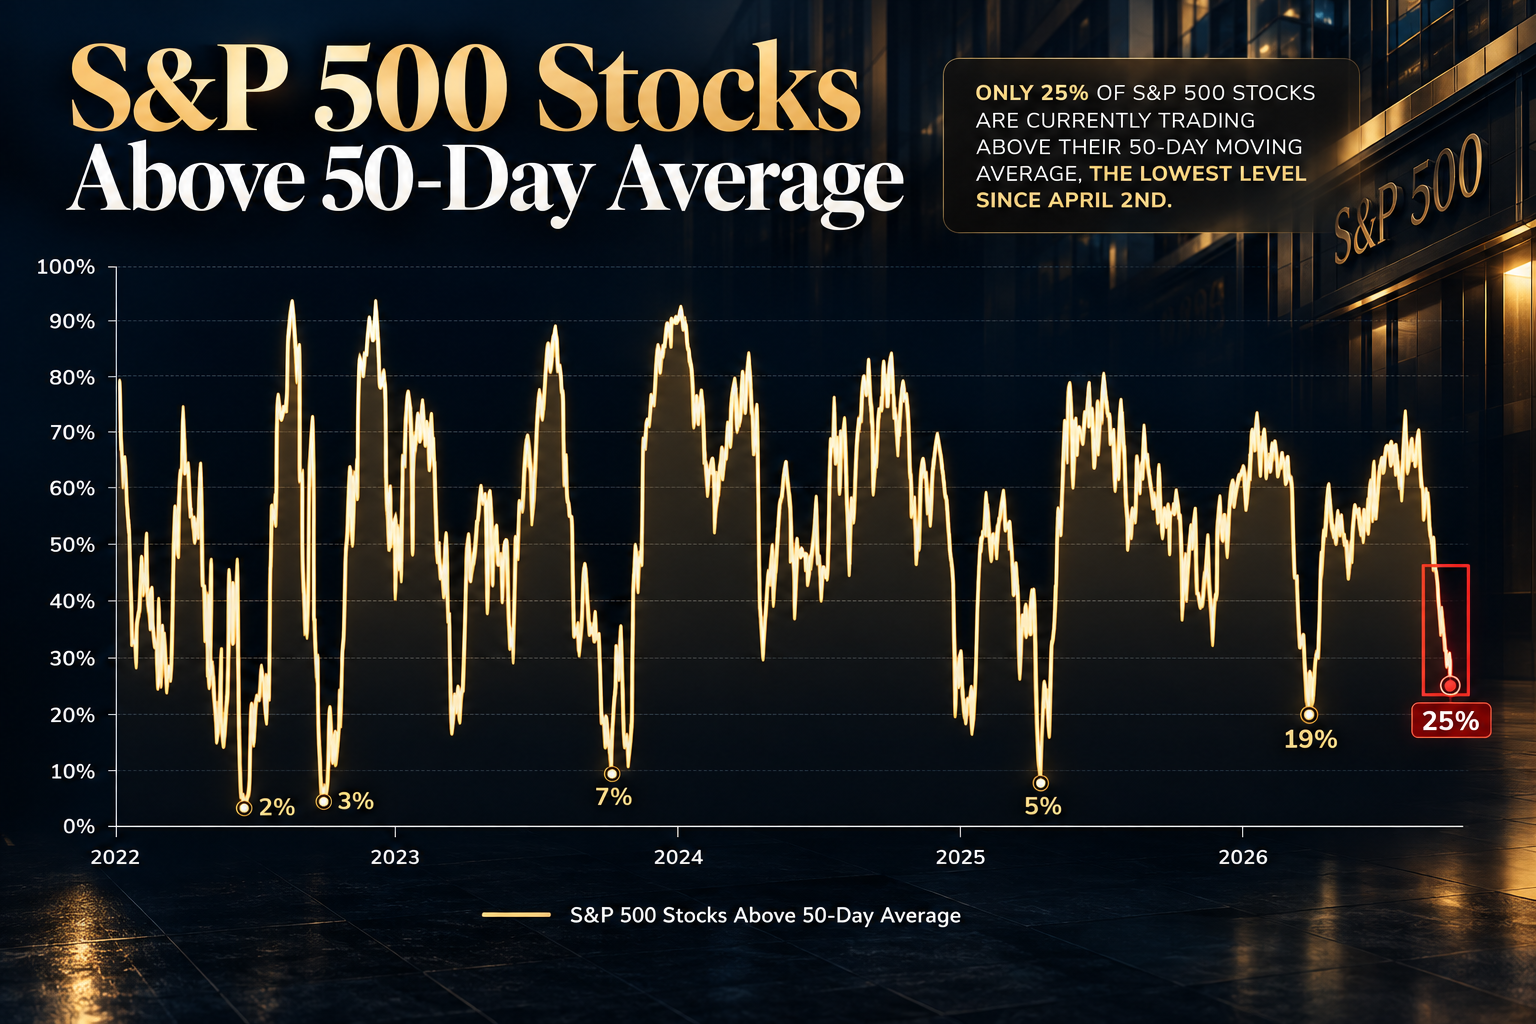
Chart: Share of S&P 500 shares above the 50-day moving average.
The key figure is not the S&P 500 level, but the number of shares behind it
When the S&P 500 is rising, it is not enough to look at the change in the index itself.
The index is capitalization-weighted. This means that the largest companies have much more influence on it than companies with less capitalization.
Therefore, a situation in which large leaders keep the index at high levels, along with the deterioration of the position of most other components, is quite possible.
And it is this imbalance that is now attracting attention.
According to the data provided: s&P 500
25%shares are above the 50-day average;
in mid-August, the indicator was about70%;
47%the shares are above the 200-day average;
new 52-week lows on the NYSE have recently far surpassed new highs.
This does not automatically mean that the S&P 500 should move to a large-scale decline. But that meansthe growth of the index becomes less broad.
Why a 50-day average is important
The 50-day moving average is used as one of the indicators of the medium-term trend.
If a stock is above this line, it usually means that its price maintains a relatively strong position relative to its own recent trend. If the majority of the index shares are above the 50-day average, participation in the movement is usually wider.
When the indicator declines rapidly, the market begins to lose internal support.
That is why the change from about 70% in mid-August to 25% now looks much more important than one single day candle of the S&P 500.
A similar picture has been observed before. For example, as of April2, 2026about 27.6% of the S&P 500 components were above the 50-day average.
At the same time, historical analogies are not a forecast: the same values of market breadth can occur in completely different macroeconomic conditions.
Another signal is a 200-day average
The 50-day average shows the shorter-term state of the market. The 200-day average is a much longer-term context.
According to the initial data provided, it is now about47% of the S&P 500 is above its 200-day average.
This means that more than half of the index's components are below the level that many market participants use to assess the long-term trend.
It is especially important to take into account heredate and calculation method. Different market data providers may produce slightly different values depending on the timing of the update and the composition of the sample.
For example, MarketWatch/FactSet live data as of September 29 already indicated about40.8% of S&P 500 components are above the 200-day average.
Therefore, for publication, it is more correct to perceive 47% from the source material as a specific value of the source/point in time used, and not as a universal value that does not change during the trading session.
The most interesting things happen at the 52-week extremes
Another metric to look at is the number of new 52-week highs and lows.
If new highs prevail, it means new leaders are emerging within the market.
If the new lows begin to significantly exceed the highs, the market loses the number of stocks that can support the upward movement.
At the session on September 29, 2026, data on the American market actually showed a significant preponderance of new lows: among NYSE-listed shares there was234 new 52-week lows vs. 11 new highs.
This is especially noticeable as the S&P 500 itself remains well above the levels the market saw in the spring.
This is where the main conflict of the current situation appears:
The index looks more stable than its internal structure.
Why is this happening?
One reason cannot explain the situation.
The market is simultaneously affected by several factors.
1. Increase in Treasury yields
In recent days, pressure on stocks has been increased by rising US bond yields.
On September 29, the 10-year Treasury yield reached about5,29%, and the 30-year yield climbed above 5.6%. Reuters noted that the rise in yields occurred against the backdrop of persistent inflation fears and increased uncertainty around oil prices and geopolitics.
Higher bond yields increase the opportunity cost of owning stocks and may create additional pressure primarily on the most rate-sensitive segments of the market.
2. Strong influence of the largest companies
The cap-weighted S&P 500 is able to remain relatively resilient even when many of its components are already weakening.
Therefore, the index itself does not always reflect the average performance of the individual companies within it.
This is one reason why analysts follow not only the S&P 500, but also equal-weight indices, advance/decline statistics and the number of stocks above key averages.
3. Rising cost of financing
High Treasury yields become a particularly important factor for companies whose valuations are sensitive to the cost of capital.
If yields rise, the market has to re-evaluate the value of future cash flows.
This does not necessarily lead to a decline in the entire market, but it can increase the stratification between individual sectors and companies.
The market is already showing signs of contraction
It’s not just today’s performance that is important.
The dynamics since mid-August show how quickly the internal structure of the market has changed.
Around August70% of S&P 500 stocks were above their 50-day average. By September, this figure had consistently decreased. At the beginning of September it was already around 42%, according to Barchart data, after which the pressure continued.
Thus, we are not talking about a single weak day.
It's aboutseveral weeks of gradual reduction in the number of shares participating in the market movement.
It is the duration of such a process that makes the indicator important to monitor.
What is important for an investor to understand
Weak market breadth is not an independent signal that the S&P 500 is bound to fall.
Market breadth answers another question:
How widely distributed is the current movement?
If the index is rising and the number of stocks above the 50- and 200-day averages is gradually decreasing, this suggests that participation in the movement is becoming narrower.
If, after a period of weakness, breadth begins to recover, this may mean the opposite process - the return of more shares to the upward movement.
Therefore, it is much more useful to follow not one number, but itsdynamics.
What to track now?
1. Share of S&P 500 stocks above 50-day average
This is one of the most convenient indicators of medium-term market width.
What to watch:will the indicator stop decreasing and begin to return above 50%.
2. Proportion of stocks above 200-day average
This indicator allows you to understand how broadly the long-term uptrend continues.
What to watch:stabilization or further decline.
3. New Highs vs New Lows
Shows how many stocks are making new 52-week highs and lows.
What to watch:whether the preponderance of new lows is shrinking.
4. Equal-weight S&P 500
Comparing the regular S&P 500 with its equal-weight version helps to see how the performance depends on the largest companies.
What to watch:whether the average stock is starting to outperform the capitalization-weighted index.
5. 10-Year Treasury Yield
Bond yields remain one of the key factors in the valuation of US stocks.
What to watch:Will yields continue to rise or will there be stabilization?
The main contradiction of the market
Now it is important not to confuse two different things.
Weak market width ≠ guaranteed collapse.
But alsostable index ≠ broad market strength.
On September 29, the S&P 500 closed at about 7,670, down 0.2% on the day. At the same time, Reuters noted continued pressure from high bond yields, and internal market statistics showed a more noticeable deterioration.
That's why it's especially important to watch nowbelow the index surface.
If the number of stocks above key averages continues to decline and new lows remain well above new highs, the divergence between the index and its internal composition will persist.
If breadth begins to recover quickly, the current weakness may turn out to be more local than it appears today.
Main conclusion
The US stock market is currently showing an interesting divergence:The S&P 500 remains relatively stable while market breadth deteriorates markedly.
Only 25% of the stocks in the data set are above their 50-day average, down from about 70% in mid-August. At the same time, the number of stocks reaching new 52-week lows is growing, and pressure from high Treasury yields continues.
This does not provide a ready-made forecast of the direction of the S&P 500.
But it gives an important signal about the quality of the current movement:The market is becoming narrower, and this process is now worth monitoring as much as the index itself.
The next few sessions will show whether the market's breadth can stabilize - or whether the weakness will continue to spread to more companies.