
The S&P 500 is at its highs, but the market is losing breadth: a wake-up call for investors
The US stock market continues to hold close to historical highs. However, behind the relatively confident dynamics of the S&P 500, there is a less optimistic picture: fewer and fewer shares are participating in the overall upward movement.
At first glance, the index looks stable.But if you look at the internal structure of the NYSE, the situation becomes more interesting. The Advance-Decline Line indicator does not confirm the new highs of the S&P 500, and the share of shares trading above their 150-day moving average has dropped to 40.82%.
This is an important discrepancy. The index can continue to grow thanks to a limited group of large companies, even when a significant part of the market no longer supports this movement.
For investors, the main question now is not only whether the S&P 500 can continue to grow, but also how much of the US market is really involved in the rally.
The S&P 500 is growing, but not the entire market follows
One of the important indicators of the state of the stock market is Market Breadth, or market width.
It allows you to estimate how many individual stocks support the movement of the index. This is especially important for the S&P 500, since its dynamics do not always reflect the state of all its member companies, and even more so the US stock market.
Imagine the situation: several of the largest technology companies show strong growth and support the index. At the same time, hundreds of other stocks stagnate or gradually lose their positions.
As a result, the S&P 500 can look confident, although the real picture within the market is becoming increasingly heterogeneous.
It is this discrepancy that is now attracting attention.
Advance-Decline Line: an indicator that does not yet confirm the growth
One of the most revealing tools for market breadth analysis is the NYSE Advance-Decline Line (A-D Line).
It reflects the accumulated difference between the number of rising and falling stocks on the exchange.
If there are more rising shares than falling during the trading period, the indicator increases. If the situation is reversed, it decreases.
The main value of the indicator is that it helps to understand how widely the market is involved in the movement.
In a healthy uptrend, the new highs of the stock index are usually accompanied by a similar movement of the Advance-Decline Line.
But now there is a different picture.
The S&P 500 holds near the top of its range, while the NYSE Advance-Decline Line remains below previous highs.
This means that the growth of the index has not yet received full confirmation from a wide group of stocks.
By itself, such a divergence does not mean that the market will necessarily turn down. However, it indicates a decrease in the internal strength of the upward movement.
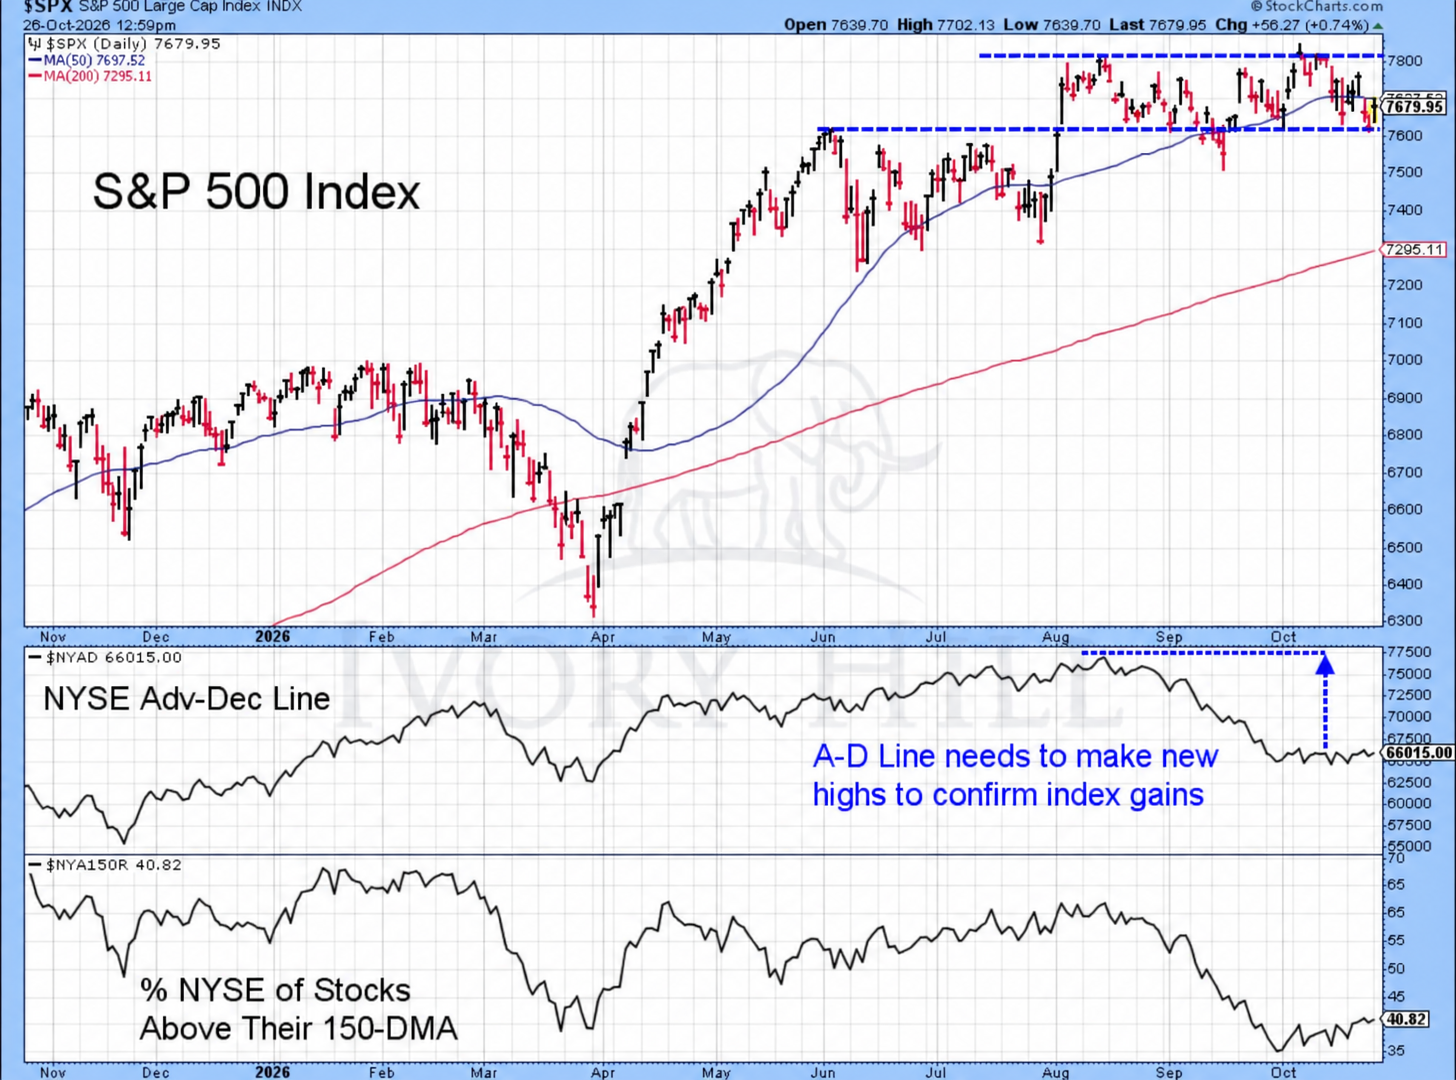
Only 40.82% of NYSE shares are above the 150-day average
An even clearer picture is provided by the second indicator - the percentage of NYSE shares that trade above their 150-day moving average.
The Moving Average smoothes price fluctuations and helps determine the medium-term direction of the asset.
If a stock is above its 150-day average, it indicates that its current price is above the average for the relevant period.
On the presented market slice, the indicator is only 40.82%.
In other words, less than half of NYSE shares are above their 150-day average. Most of the market does not demonstrate a stable position above this medium-term benchmark.
This is an important contrast to the dynamics of the S&P 500 itself.
When the index is held near highs, and the share of stocks above the long-term averages remains so low, the question arises about the concentration of market growth.
Perhaps a relatively small group of companies maintains a positive trend, while a significant part of the rest of the market participants does not show similar strength.
Why can a narrow rally be a problem for the S&P 500?
The main problem of a narrow rally is that the stability of the index begins to depend more on a limited number of large companies.
When most of the market is involved in growth, the movement has a broader basis.Different sectors and groups of companies maintain the overall dynamics, which makes the upward trend more balanced.
But if the growth is concentrated in a small number of shares, the situation changes.
First, the index becomes more sensitive to results and expectations around the largest companies.
Second, deteriorating sentiment in some large sectors can have a disproportionate impact on the overall market.
Thirdly, the weakness of the remaining stocks may indicate that investors are becoming more selective and are not ready to distribute capital throughout the market.
At the same time, it is important to take into account: a narrow rally does not necessarily end in a fall. Sometimes the leadership of a limited group of companies lasts long enough, and the rest of the shares gradually catch up with the market.
Therefore, the market width is not an independent tool for forecasting the collapse, but an additional way to assess the quality of the current trend.
What could happen next?
The current situation allows for several scenarios.
Scenario 1: Market width begins to recover
This is the most positive option.
If the Advance-Decline Line starts to update the highs, and the percentage of shares above the 150-day average begins to increase, this will mean that the growth gradually extends to a wider group of companies.
In this case, the current discrepancy between the index and the internal market indicators may be temporary.
Scenario 2: The S&P 500 continues to grow, but market breadth remains weak
This is a scenario for the continuation of a narrow rally.
The index may maintain upward momentum thanks to the largest companies, but internal indicators will continue to show insufficient support.
In such a situation, it is important for investors to monitor not only the new highs of the S&P 500, but also how many individual shares are involved in the movement.
Scenario 3: The index begins to adjust
A more negative option suggests that the weakness of the market width will gradually begin to affect the index itself.
If the largest companies lose the support of buyers, the insufficient width of the upward movement can make the overall dynamics of the market more vulnerable.
However, current indicators alone do not allow us to say that the correction has already begun or will necessarily occur.
What should investors track now?
To assess whether the situation in the US stock market is getting better or worse, you should pay attention to several indicators.
1. NYSE Advance-Decline Line
Shows the ratio of rising and falling stocks in cumulative terms.
The main signal: the update of the highs together with the S&P 500 will confirm the expansion of market growth.
2. Percentage of shares above 150-day average
It allows you to assess which part of the market retains medium-term technical strength.
The main signal: a steady growth of the indicator above the current 40.82% will indicate an improvement in the width of the market.
3. The S&P 500 and its 50-day moving average
It helps to assess the short-term condition of the index.
The main signal: the ability of the index to stay above average and return to growth will be important for assessing the current trend.
4. Concentration of growth in the largest companies
It is important to track whether the positive momentum extends to other sectors and companies or still depends on a limited number of leaders.
The main signal: the participation of more shares will indicate a more balanced movement.
5. New NYSE Highs and Lows
This indicator helps to assess whether the number of companies reaching new price extremes is expanding.
The main signal: an increase in the number of shares updating the highs will be additional confirmation of the improvement in the market structure.
Main conclusion: the index does not show the whole picture
The S&P 500 remains a critical benchmark for U.S. stock market valuations. But looking solely at its meaning is not enough.
Current market widths point to a notable divergence: the index holds near highs, while Advance-Decline Line does not confirm this movement, and only 40.82% of NYSE shares are above their 150-day average.
This is not a signal for the automatic sale of American shares and not a proof of the imminent collapse.
But this is a reason to be more attentive to the quality of current growth.
It is important for investors and traders now to monitor not only where the S&P 500 is heading, but also how many companies are actually supporting its movement.
It is the width of the market that can help to understand whether the uptrend is getting stronger or its foundation is gradually narrowing.